Oil and natural gas: The oil price testing the $82.00 level


Oil and natural gas: The oil price testing the $82.00 level
- During the Asian trading session, the oil price increased from $81.00 to $81.50.
- During the Asian trading session, the oil price rose to $3.06.
Oil chart analysis
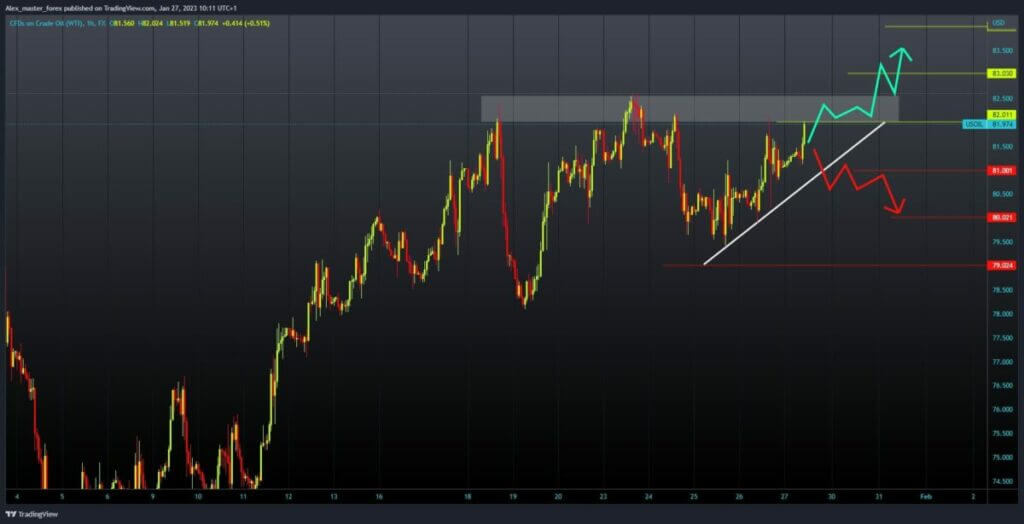
During the Asian trading session, the oil price increased from $81.00 to $81.50. In the European session, the price growth continues, and now we are at the $81.75 level. If this trend continues, we could soon reach the $82.00 level. Then we need a break above and a test of this week’s high at the $82.50 level. If we managed to break through and above it, we would have an excellent chance to start a further recovery.
A potential higher target is the $83.00 level. We need a negative consolidation and price pullback to the $81.00 level for a bearish option. Then the oil price could initiate a further decline until the next support at the $80.00 level. This week’s low oil price was at the $79.40 level.

Natural gas chart analysis
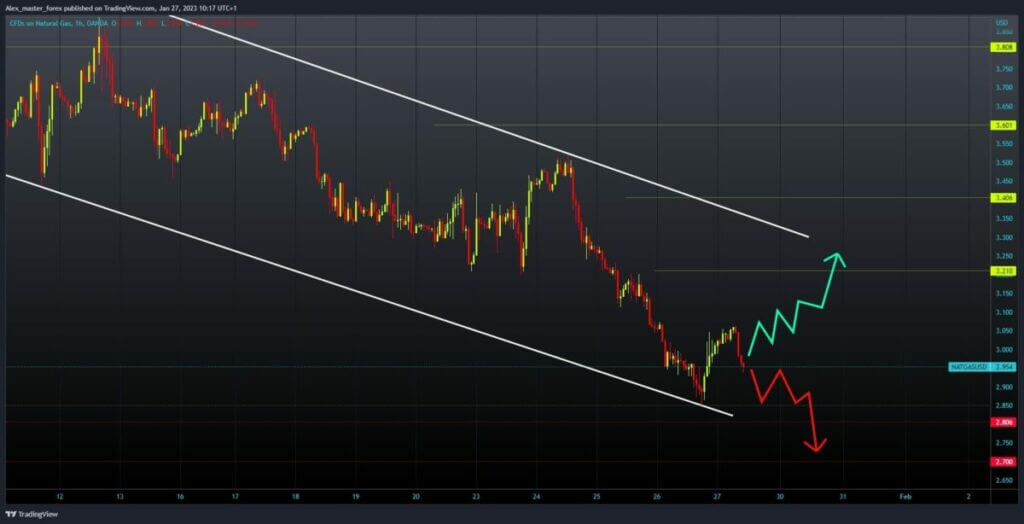
During the Asian trading session, the oil price rose to $3.06. The price encounters resistance at that level, makes another downward turn, and returns below the $3.00 level. The current gas price is $2.95, and there is a good chance that we will retest the previous low at $2.85. A break below would mean the continuation of the bearish option and the formation of a new lower low.
Potential lower targets are the $2.80 and $2.70 levels. For a bullish option, we need a new positive consolidation and a return above the $3.00 level. After that, we could think about a potential further recovery.

The post Oil and natural gas: The oil price testing the $82.00 level appeared first on FinanceBrokerage.


