

Earnings Momentum May Push the Stock Market to New Highs


"Bearish engulfing pattern," "outside day," "key reversal"—all of these are terms you may have heard after the stock market's performance on Thursday. But one day's price action doesn't necessarily make a trend. Encouraging fundamental data reversed investor pessimism and changed the overall picture relatively quickly.
A couple of key data points that were released are:
- The initial estimate suggests the US economy grew at a 2.4% annual rate in Q2. Compare that to the 1% Q1 growth. The US economy is still growing, and at a rate that's better than what economists expected.
- The Fed's favorite inflation indicator, personal consumption expenditures price index (PCE), came in slightly cooler than expected. Core PCE gained 0.2% month-over-month, which is in line with the Dow Jones estimate of a 0.2% increase. Year-over-year core PCE came in lower than estimates—up 4.1% vs. an estimate of 4.2%. That's the lowest rate since September 2021.
A few days earlier, the Fed raised interest rates another 25 basis points. Given that future interest rate decisions will be data-dependent, this piece of data is an encouraging sign that supports the possibility that an end to the tightening is near.

The GDP and inflation data helped the equity market regain its strength. After the previous day's performance, this was welcome news that restored the negative investor conference. Strong earnings from Intel Corp (stock symbol: INTC) helped the Tech sector make up some of the losses from the day before. Mega tech stocks such as Tesla (stock symbol: TSLA), Advanced Micro Devices (stock symbol: AMD), Amazon (stock symbol: AMZN), META Platforms (stock symbol: META), Apple (stock symbol: AAPL), Alphabet (stock symbol: GOOGL), and NVIDIA (stock symbol: NVDA) rose and were among the most actively traded during the trading day.
Other industries showed strength as well. If you scroll through the Market Summary tool and view the US Industry Indexes, airlines, biotechs, gold, oil services, retailers, and transports were all up greater than one percentage point.
If you were disappointed that the Dow Jones Industrial Average ($INDU) didn't make it to a 14-day winning streak, there's still a shining light. The index has seen three weeks of gains. The weekly chart below shows the uptrend is still in play.
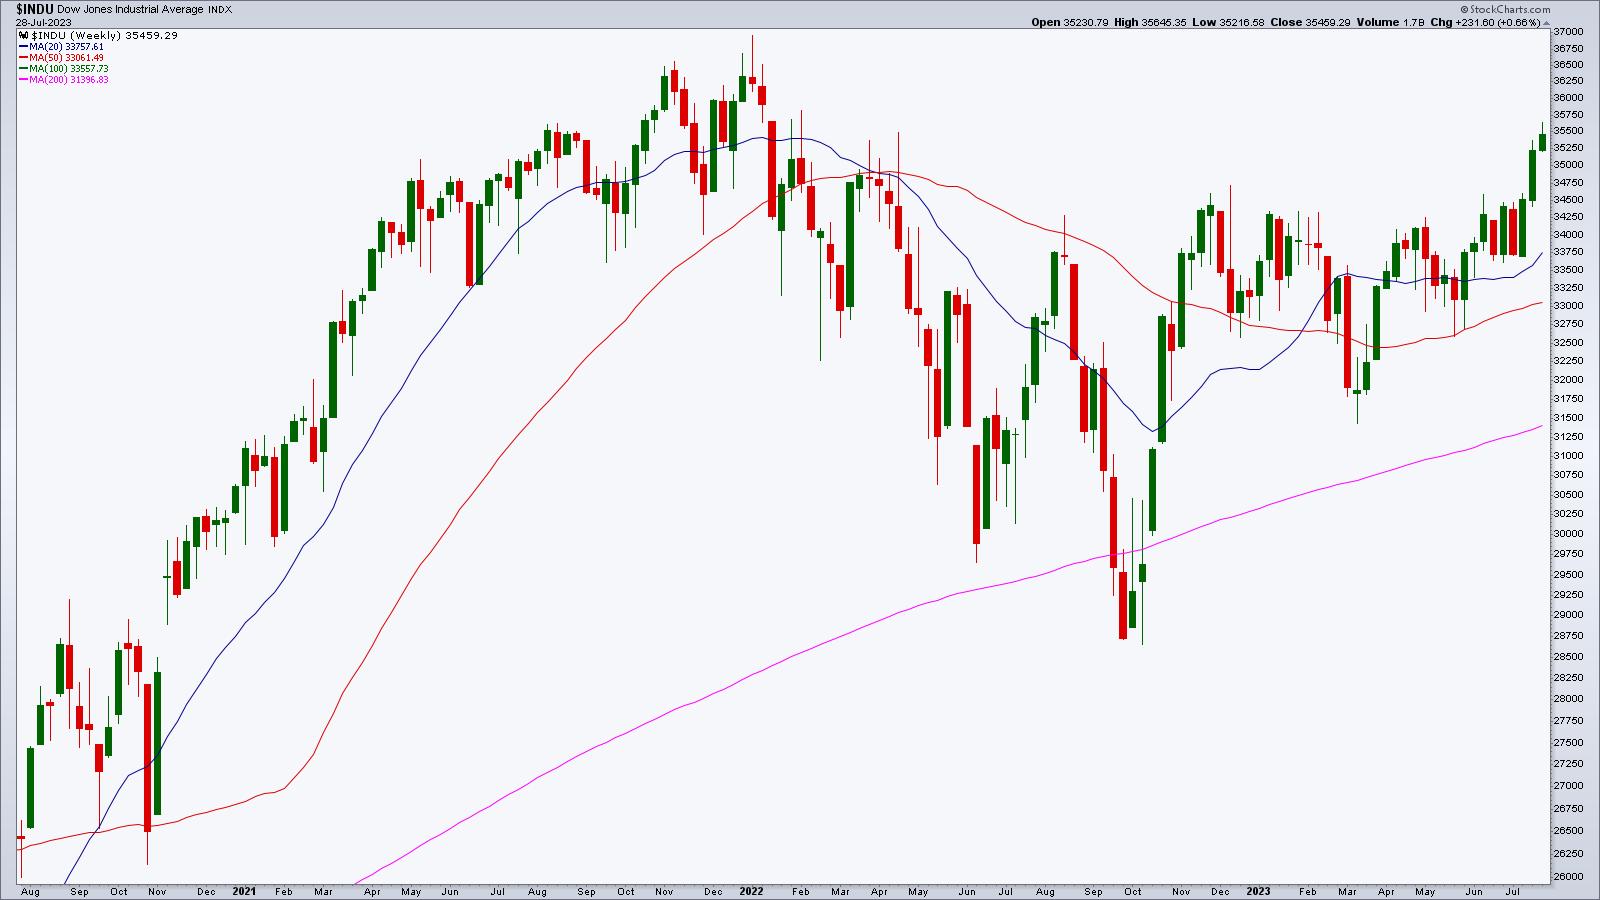
CHART 1: DOW JONES INDUSTRIAL AVERAGE ($INDU) REGISTERS THIRD STRAIGHT WEEK OF GAINS. Despite a hiccup on Thursday, the weekly chart is still trending higher and doesn't have too much in the way of resistance on the path to reaching its high. Chart source: StockCharts.com (click chart for live version). For educational purposes.
Even small-cap stocks enjoyed advances. The daily chart of the S&P 600 Small Cap Index ($SML) below shows that small caps are rallying, and the market breadth as indicated by the percentage of small-cap stocks above their 50-day moving average, the Advance-Decline Percent, and the Volume Advance-Decline Percent are showing positive breadth.
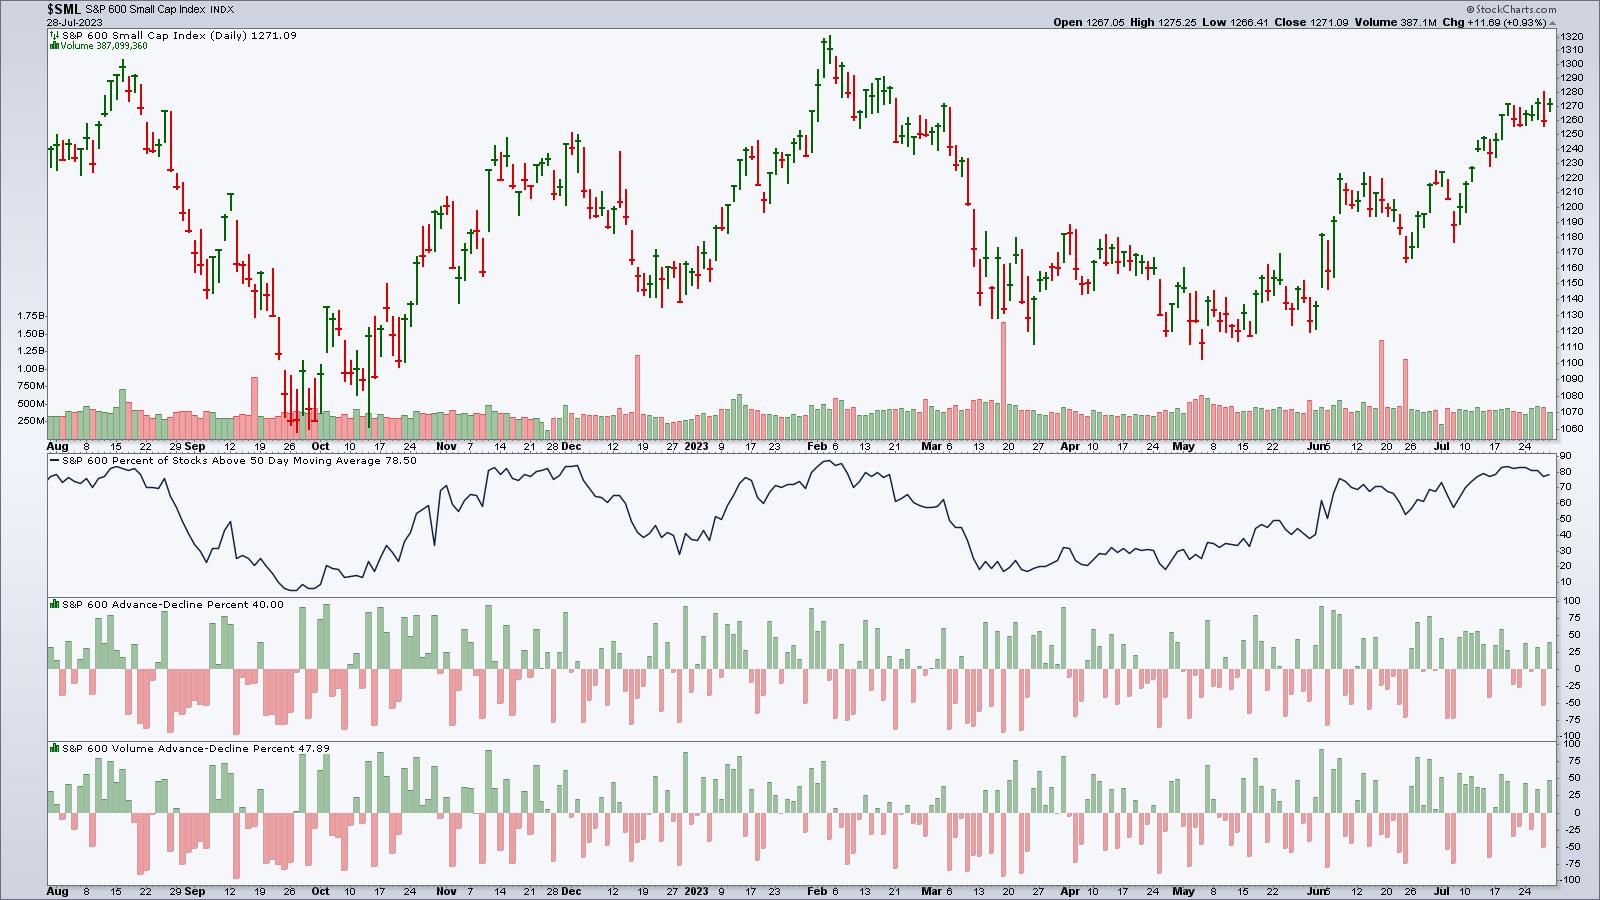
CHART 2: SMALL-CAP STOCKS DON'T WANT TO BE LEFT BEHIND. A rally and relatively strong market breadth suggest there may be some good finds in the small-cap space. Chart source: StockCharts.com (click on chart for live version). For educational purposes.
When the stock market is overextended, it's natural for investors to get jittery. So it's a good idea to watch the CBOE Volatility Index ($VIX). On Thursday, when the stock market saw a significant drop, the VIX saw a pretty wide range—from 12.74 to 15.02, closing at 14.41. This erratic VIX movement heightened fear among investors, and many thought the week would end on a negative note. But that changed, and by Friday's close, VIX closed at 13.33.
 StockCharts Tip. The Market Overview panel on Your Dashboard summarizes stock market activity in real time during the trading day. Click on the four tabs across the top—Equities, Bonds, Commodities, Crypto—to stay on top of the market action.
The Bottom Line
This week ended on a positive note. Earnings continue next week with bellwether companies AMZN and AAPL reporting. We'll also get a look at jobs data, which could give us a look at one of the important areas the Fed looks at when making interest rate decisions. It remains to be seen if earnings momentum and economic data can push the stock market to new highs.
End of Week Wrap Up
US equity indexes up; volatility down
- $SPX up 0.99% at 4582.23, $INDU up 0.5% at 35,459.29; $COMPQ up 1.9% at 14,316.66
- $VIX down 7.43% at 13.34
- Best performing sector for the week: Communication Services
- Worst performing sector for the week: Utilities
- Top 5 Large Cap SCTR stocks: Super Micro Computer (SMCI), Pohang Iron & Steel (PKX), Palantir Technologies (PLTR), NVIDIA Corp. (NVDA), DraftKings Inc. (DKNG)
On the Radar Next Week
- More earnings. Some companies reporting next week: Amazon (AMZN), Apple (AAPL), Merck (MRK), Toyota Motor Corp (TM), Pfizer (PFE), Caterpillar (CAT), and more.
- July PMI
- July ISM Manufacturing
- July ISM Services
- July Non Farm Payrolls
Disclaimer: This blog is for educational purposes only and should not be construed as financial advice. The ideas and strategies should never be used without first assessing your own personal and financial situation, or without consulting a financial professional.