

Did Friday’s Reversal Mark A Major Bottom?

The next step in the stock market will be very interesting. I’ve been discussing a potential Q1 correction since our MarketVision event the first week of January and it’s here. The NASDAQ 100 ($NDX), from its high on February 19th (22222.61) to its low on Friday (19736.81), fell 11.19% before rallying Friday. The NASDAQ 100’s correction has been reached. The small cap Russell 2000 ETF (IWM) hit a high of 244.25 on November 25th. Its low Friday was 201.73. That’s a 17.41% tumble, which is approaching bear market territory.
S&P 500 – Head & Shoulders Pattern?
So what about the benchmark S&P 500? Well, there’s plenty to consider, but I’ll give you my thoughts on what could happen here:
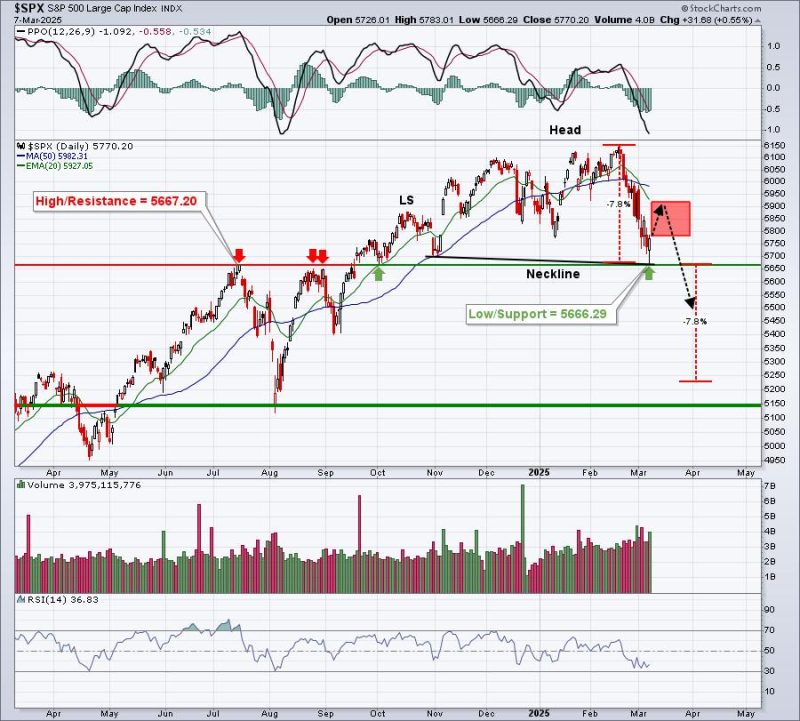
Looking at the above chart, here are several thoughts I have:
- The July price high should provide at least short-term support and it did on Friday as we saw a rally as soon as the S&P 500 touched this prior high/current support.
- Volume has accelerated on this most recent selling.
- We have potentially formed a down-sloping neckline in a topping head & shoulders pattern.
- Price momentum (PPO) is as weak as it was in early August.
- RSI has broken 40 support, which is usually a key in remaining in an uptrend.
- Selling thus far has taken the S&P 500 down 7.83% at Friday’s low, a bit shy of a 10% correction.
- If we bounce into a potential right shoulder, it’ll be important to see how money rotates; if the current downtrend remains in play, then I doubt we’ll see the S&P 500 clear 5900 on a bounce, especially if leadership on that bounce is poor.
- A VERY EARLY head & shoulders projection would suggest a possible move on the S&P 500 to 5225 or so.
Fundamental news the next two weeks, along with the market’s reaction and rotation, will likely determine our path over the next month or so. Here are the critical economic releases/events to put on your calendar:
- Consumer Price Index (CPI) – Wednesday, March 12th, 8:30am ET
- Producer Price Index (PPI) – Thursday, March 13th, 8:30am ET
- Fed (FOMC) Meeting – Tuesday, March 18th – Wednesday, March 19th (policy statement at 2:00pm ET)
Listen, this recent selloff has been widely expected, if you follow market rotation and sentiment, and keep a healthy dose of perspective handy. Everyone likes to use fundamental arguments and their perception of the market environment to call bear markets……nearly every year. Few pay attention when the warning signs are out there, but everyone becomes an expert after the market begins to tumble.
I absolutely remain long-term bullish and believe that, once the current bearish phase ends, the S&P 500 will rally back to all-time highs. We may have to endure further pain first though. I doubt we’ve seen the ultimate 2025 bottom. We’ll need some very good news on CPI, PPI, and from the Fed meeting. I’d give that a 20-25% chance at this point.
Sentiment
For awhile, the 5-day SMA of the equity only put call ratio suggested that traders had grown way too bullish in the near-term and this is a contrarian indicator, meaning that the stock market usually moves opposite of sentiment, especially if the bullish or bearish sentiment extends too long. Take a look at the CPCE 5-day SMA over the past year:
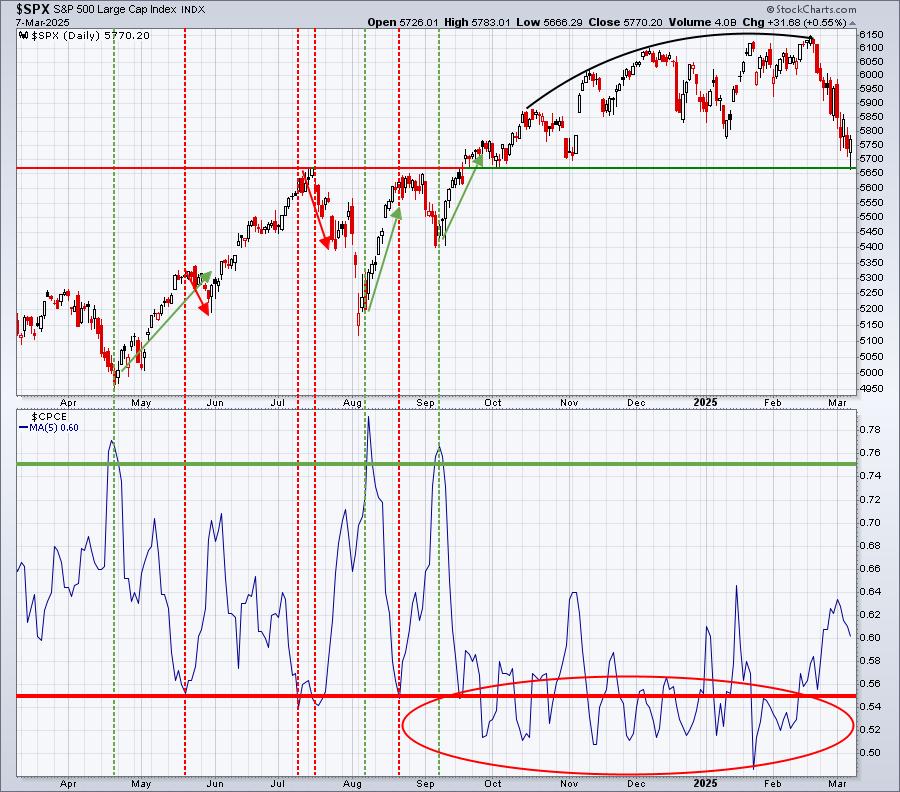
I use the .55 level as the level at which options traders are growing too bullish and it signals a potential short-term top. On the above 1-year chart, you can see how effective 5-day SMA readings were in marking multiple short-term tops (red-dotted vertical lines). However, over the past 4-5 months, the 5-day SMA reading nearly lived at .55 or below (big red circle). That’s an extended period of bullishness and you can see that the S&P 500 really struggled to print higher highs (black curved line), despite all of the optimism and bullishness among options traders.
The 5-day SMA of the CPCE at .75 also has a tendency to suggest a short-term market bottom as options traders grow overly pessimistic. Look at where we are now. Despite a near bear market in small caps, a correction on the NDX, and a near-correction on the S&P 500, the 5-day SMA of the CPCE remains WELL BELOW .75 and even fell last week! This simply suggests that optimism remains and that could lead to further selling in the weeks ahead.
It’s EB Education Week!
Given the prior warning signs and the recent increased market volatility, we’ve encouraged members over the past couple months to be careful and that cash is absolutely a position to consider. It also is a GREAT time to think about ways to better your trading success. I know many of you have followed me over the years, so I thought it would be an awesome time to discuss much of our research and how we do things at EarningsBeats.com. So for one week only, we are going to show exactly how we put together all of our ChartLists on the StockCharts.com platform.
These are intended to be brief “classes” this week, all starting at 5:30pm ET and lasting 45 minutes or so each. If you can’t attend any (or all) of these events live, no worries at all. We’ll record them and make sure all that register receive a copy of the recording.
To learn more, register, and save yourself a spot, sign up here. It’s time to gear up now, during this market weakness, for a better market and rally ahead. Join us and learn to trade smarter!
Happy trading!
Tom