From Relic To Reckoning: Can Gold Surge To $3,000?


The strange thing about gold is that it’s always a relic … until it isn’t. And when it isn’t, everyone swears it’s always been an alternative currency (why would anyone have thought it was a relic in the first place?).
Relic or “sound money” reckoning, the yellow metal’s surge—notching a record-high of $2395.60—stunned non-believing investors and even die-hard gold bugs. Here’s the thing: some analysts are saying this record high is not the top but rather the bottom range.
Why Are Some Analysts Claiming Gold Can Reach $3,000?
$3,000 an ounce is 25% higher than the current price and a 64% rally from its last significant low in October 2023. But what would drive gold to such heights?
- Fiat currencies under pressure; financial repression (as BofA noted back in 2020)?
- Stubborn inflation; massive government debt (says European financial engineering firm, Mind Money)?
- BRICS de-dollarization efforts; new gold-backed currencies being issued across the globe—all aimed at challenging the US dollar’s unipolar position?
Let’s take a look at the gold’s macro price action.

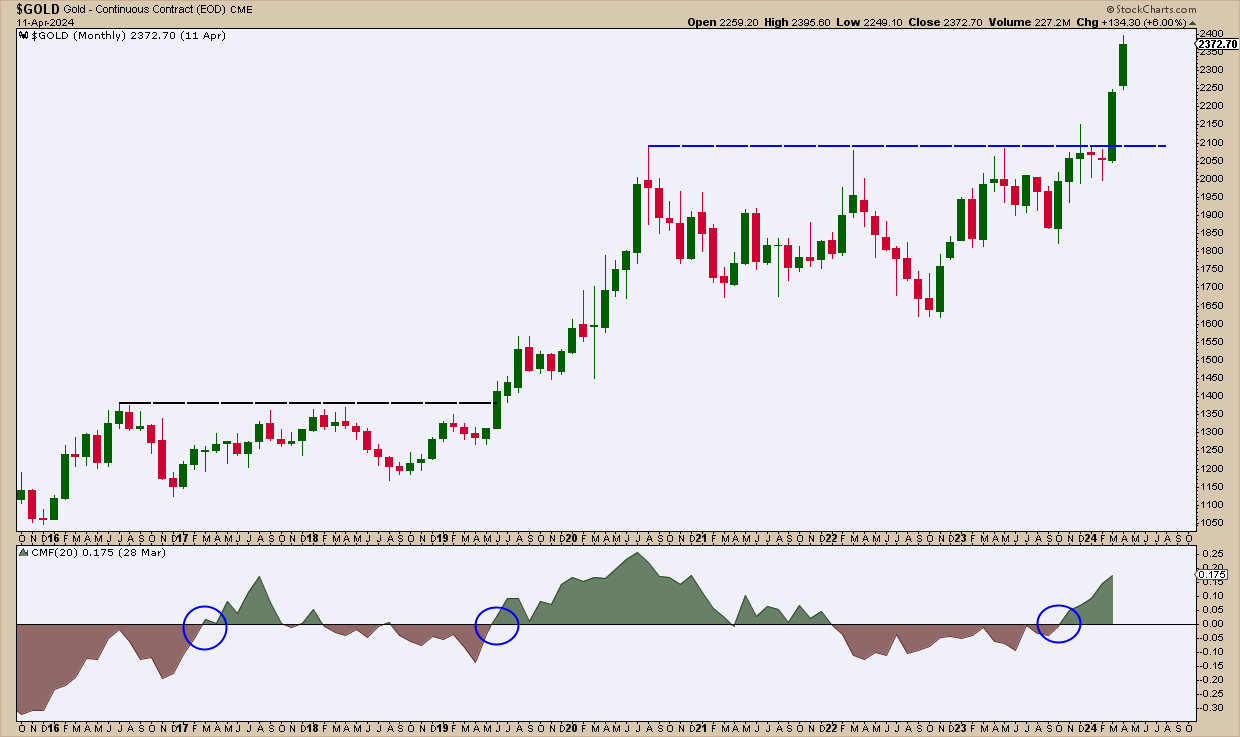
CHART 1. MONTHLY CHART OF $GOLD. Note its series of sideways fits and start leading up to its current parabolic rise. Chart source: StockCharts.com. For educational purposes only.
Here’s gold’s trajectory starting with its 2016 low. Most of the time, the yellow metal traded within a fairly wide range between uptrends.
Note the Chaikin Money Flow (CMF) highlighted in blue circles. This indicates momentum via buying pressure.
- In 2016, buying pressure rose after gold had established its high (institutional buying?) but selling pressure got nowhere near the depth it did before reaching that high.
- In 2019, CMF levels again broke above the zero line, this time followed by a mighty breakout (see black dashed line) and rally as the Fed’s repo market injections were likely perceived as yet another form of quantitative easing.
- And in late 2023, despite high valuations but amid escalating geopolitical risks and de-dollarization worries, the CMF broke above the zero line again, leading to the incredible surge we saw over the last two months.
Here’s the big question …
Is 2023’s Price Ceiling the New Price Floor for 2024 and Beyond?
Currently, analysts from leading banks are revising their gold forecasts noting the clash between short-term economic shifts and deeper geopolitical fractures are rendering traditional valuation metrics obsolete.
Let’s take a look at the current price action.

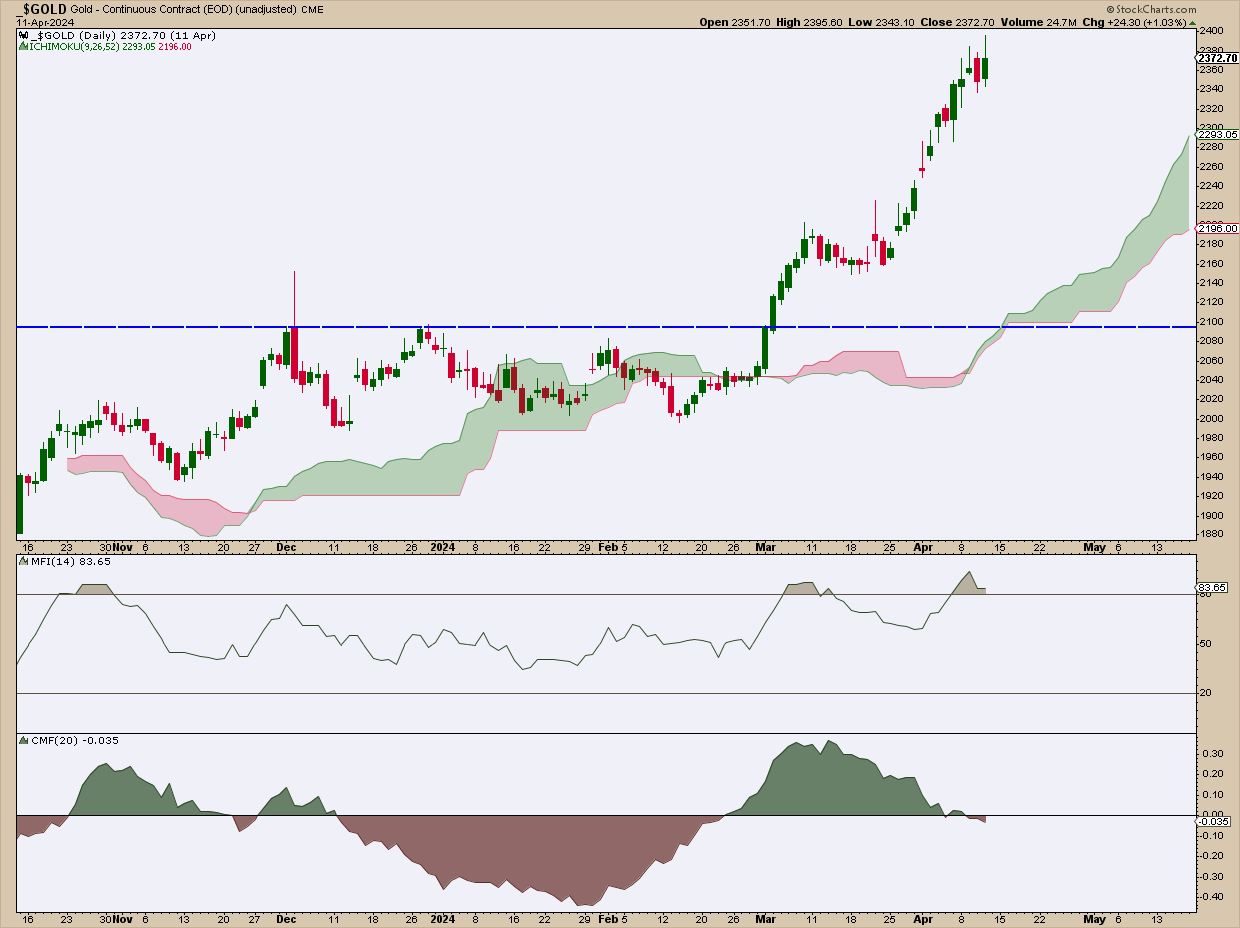
CHART 2. DAILY CHART OF $GOLD. Note the parabolic move that’s losing momentum. Chart source: StockCharts.com. For educational purposes.
If you’ve been following national news, you’re probably aware that gold bullion sells like hotcakes at Costco. What does this say? Despite its sky-high valuations, it tells us there’s a frantic retail dash for gold.
Still, there are many technical and fundamental reasons to expect a pullback.
- For starters, sticky inflation (did you see the latest CPI and PPI report?) indicates the possibility of interest rates being higher for longer.
- The Money Flow Index (MFI), a volume-weighted RSI, is well within “overbought” territory.
- The CMF, this time on a daily scale, has dipped into “selling pressure” territory.
Yet, there are many reasons to be bullish on gold—technically, from a macro perspective (as you can see in the monthly chart above) and fundamentally, as discussed at the top of this article.
Keep an eye on $2,100—that’s the 2023 resistance level. Will it provide support for a next leg up?
When prices dip, what if it doesn’t sink to that level? In this case, watch the most current swing low at $2,150 in conjunction with the Kumo range of the Ichimoku Cloud.
Gold is the Fear Trade
Gold’s rally to $2,395.60 and the whispers of a potential climb to $3,000 mark a seismic shift in how investors view the age-old asset. It also reflects fears surrounding the economy, the future status of the dollar amid de-dollarization, and dwindling faith in the Federal Reserve’s capacity to implement sound monetary policy.
Gold is the fear trade. And if you’re bullish on gold and monitoring all of the fundamental and geopolitical news affecting its valuations, now you have the technical context to get the 360-degree view you need to make your own forecast.

Disclaimer: This blog is for educational purposes only and should not be construed as financial advice. The ideas and strategies should never be used without first assessing your own personal and financial situation, or without consulting a financial professional.


